|
|

|

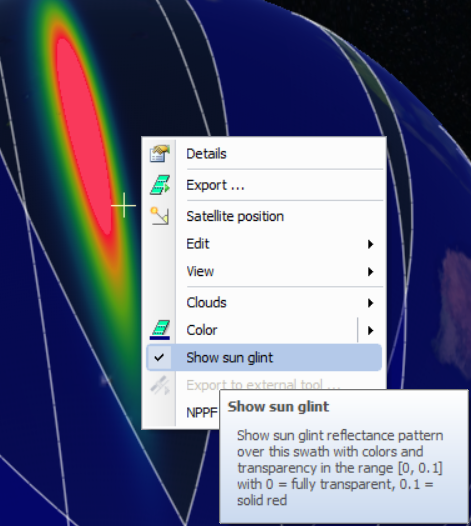
Sun Glint visualization
Sun glint can be visualized over any swath by pop-up menu "Show sun glint". The swath will be drawn by displaying the sun glint area in colours, ranging from blue to red, and increasing transparency. Sun glint normalized reflectance will be displayed only in the range[0, 0.1], with 0 = fully transparent , and 0.1 = solid red.
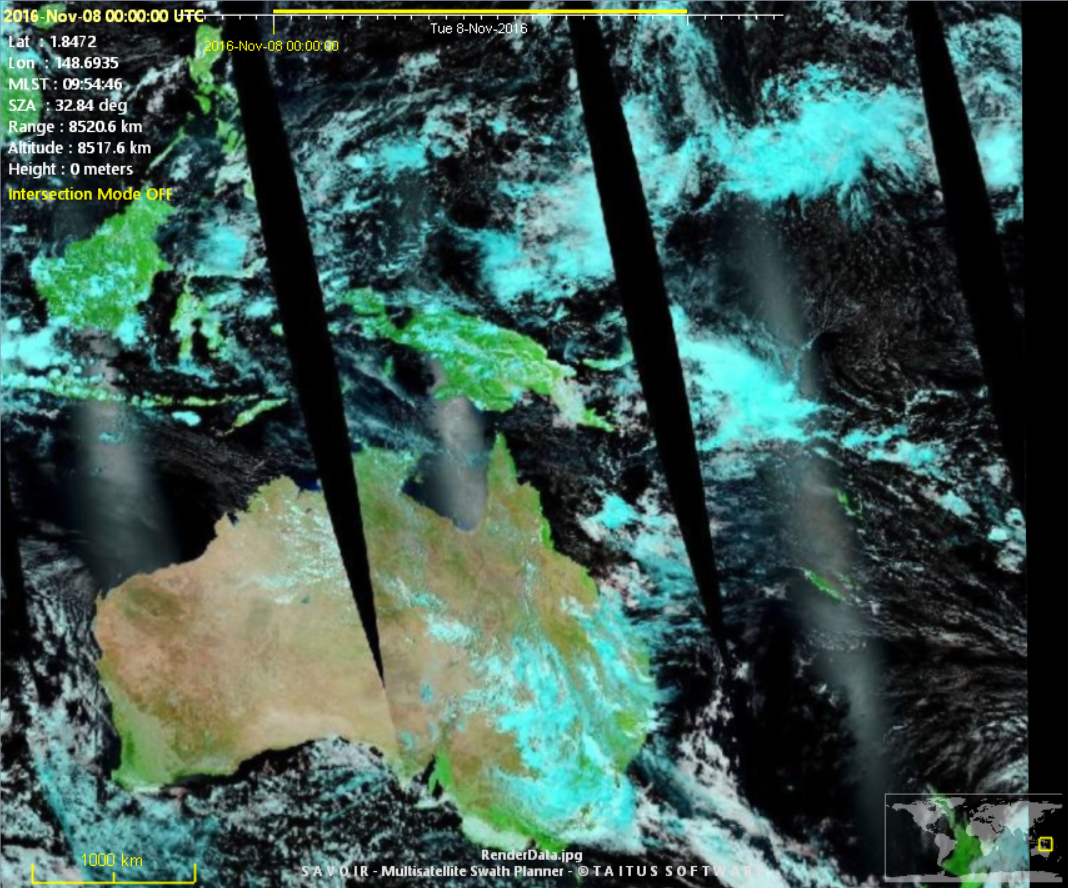
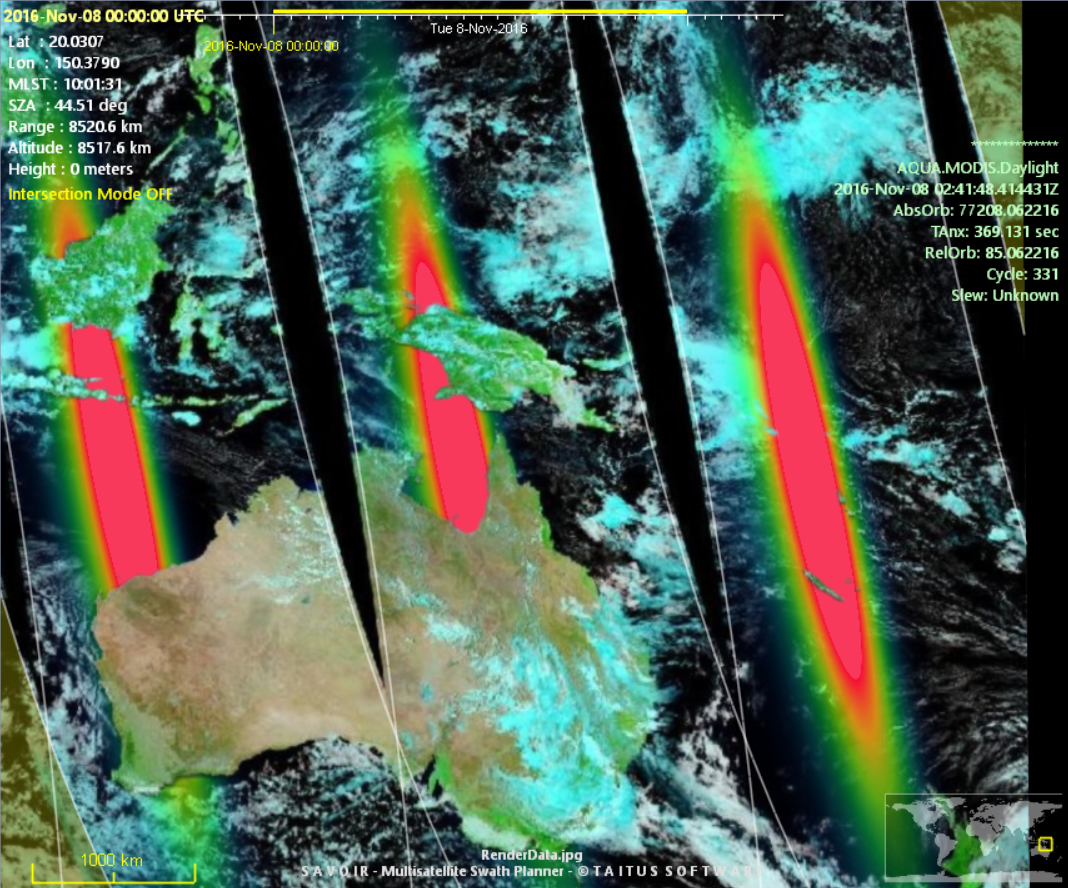
The following example shows a comparison between real acquisitions of Aqua MODIS sensor over the Australia, with sun glint clearly visible, and the equivalent simulation by SaVoir .
Multisatellite Swath Planner - © Taitus Software Italia srl All rights reserved- info: support@taitus.it